When a $3 million ARR SaaS company reached out via RFP claiming their biggest problem was churn, it got us thinking. Most founders fixate on that monthly churn percentage—hitting that “healthy” 3-5% range and calling it a day. But here’s the uncomfortable truth: even “good” churn numbers can mask serious growth problems that are quietly sabotaging your business.
In this podcast episode, we break down why churn is far more complex than a single metric and share the framework we use to diagnose and fix retention issues that are actually holding back growth.
The problem with “healthy” churn
Most B2B SaaS companies celebrate when they hit 3-5% monthly churn. It feels like a milestone—you’ve reached the promised land of “acceptable” retention. But this number alone tells you almost nothing about the health of your business.
We’ve seen companies with 3% monthly churn that have terrible long-term retention. We’ve also seen businesses achieve net negative churn, where expansion revenue from existing customers outpaces losses. The difference? They understood that churn isn’t just one number—it’s a complex system that requires deeper analysis.
Qualified vs. unqualified churn: The critical distinction
Not all churn is created equal. When we work with clients, we like to separate churn into two buckets:
Qualified churn: Customers who were a good fit for the product and should have stayed
Unqualified churn: Customers who weren’t a great fit to begin with
This distinction matters because losing qualified customers hurts. Losing unqualified customers? That might actually be healthy for your business. The key is collecting enough data during signup (2-3 qualifying questions max) to segment your churn analysis properly.
If most of your churn is unqualified, you might have an acquisition problem—you’re attracting the wrong customers. But if qualified customers are leaving, that’s where you need to focus your retention efforts.
The metric that actually matters: Net revenue retention
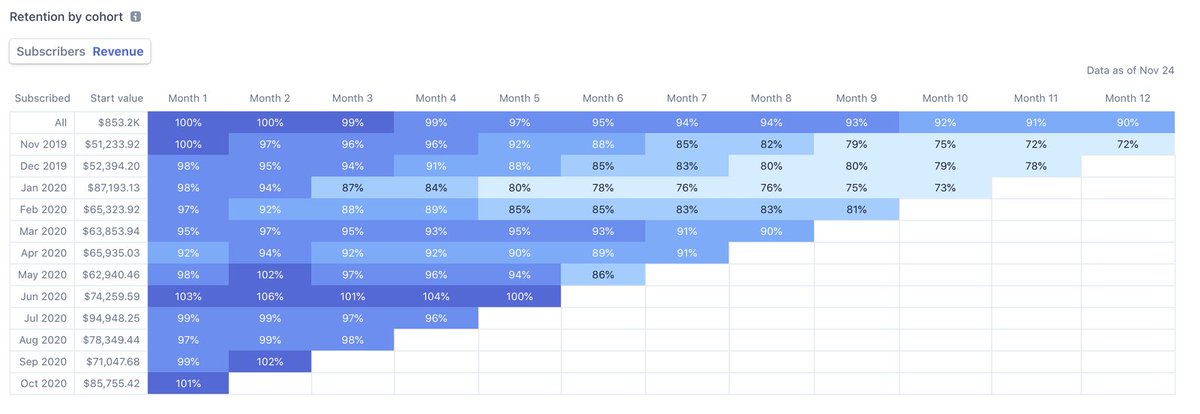
Example of Stripe’s NRR report
Monthly churn gives you a snapshot. Net Revenue Retention (NRR) tells you the story of your business over time. This metric looks at cohorts of customers and tracks how much revenue you retain from each group over 6, 12, or 24 months.
Here’s what the numbers mean:
- 100%+ NRR: Growth feels effortless, like guiding a boulder downhill
- 80-100% NRR: Comfortable, sustainable growth
- Below 80% NRR: Growth feels like pushing a boulder uphill
- Below 60% NRR: You’re replacing half your revenue every year
The scary part? You can have 3% monthly churn and still have poor net revenue retention. It’s the sneaky, long-term churn that kills businesses slowly.
Most SaaS founders using tools like ProfitWell already have this report available, but may not know what to do with it.
Segmented NRR: Where the gold is hidden
The aggregate NRR number is useful, but segmented NRR is where you find actionable insights. Break down your retention by:
- Customer segments (teachers vs. coaches vs. trainers)
- Plan types (starter vs. pro vs. enterprise)
- Acquisition channels
- Any other meaningful customer characteristics
You might discover that one segment has amazing retention while another bleeds customers. This tells you where to double down and where to fix fundamental issues.
The real reasons people churn (Hint: It’s not what they tell you)
Those cancellation reason dropdowns? They’re cute, but they’re not telling you the real story. When we conduct churn interviews, we find that customer departure is rarely about one issue—it’s usually a combination of forces that finally tip the scale.
Some of those forces are controllable:
- Confusion about product capabilities
- Poor support experience
- Pricing or packaging issues
- Missing but expected features
- Activation problems
Others aren’t:
- Budget cuts
- Job changes
- Shifting business priorities
- Market changes
The magic happens when you understand which controllable factors are most common across your churned customers. You can do this through churn interviews.
The churn interview framework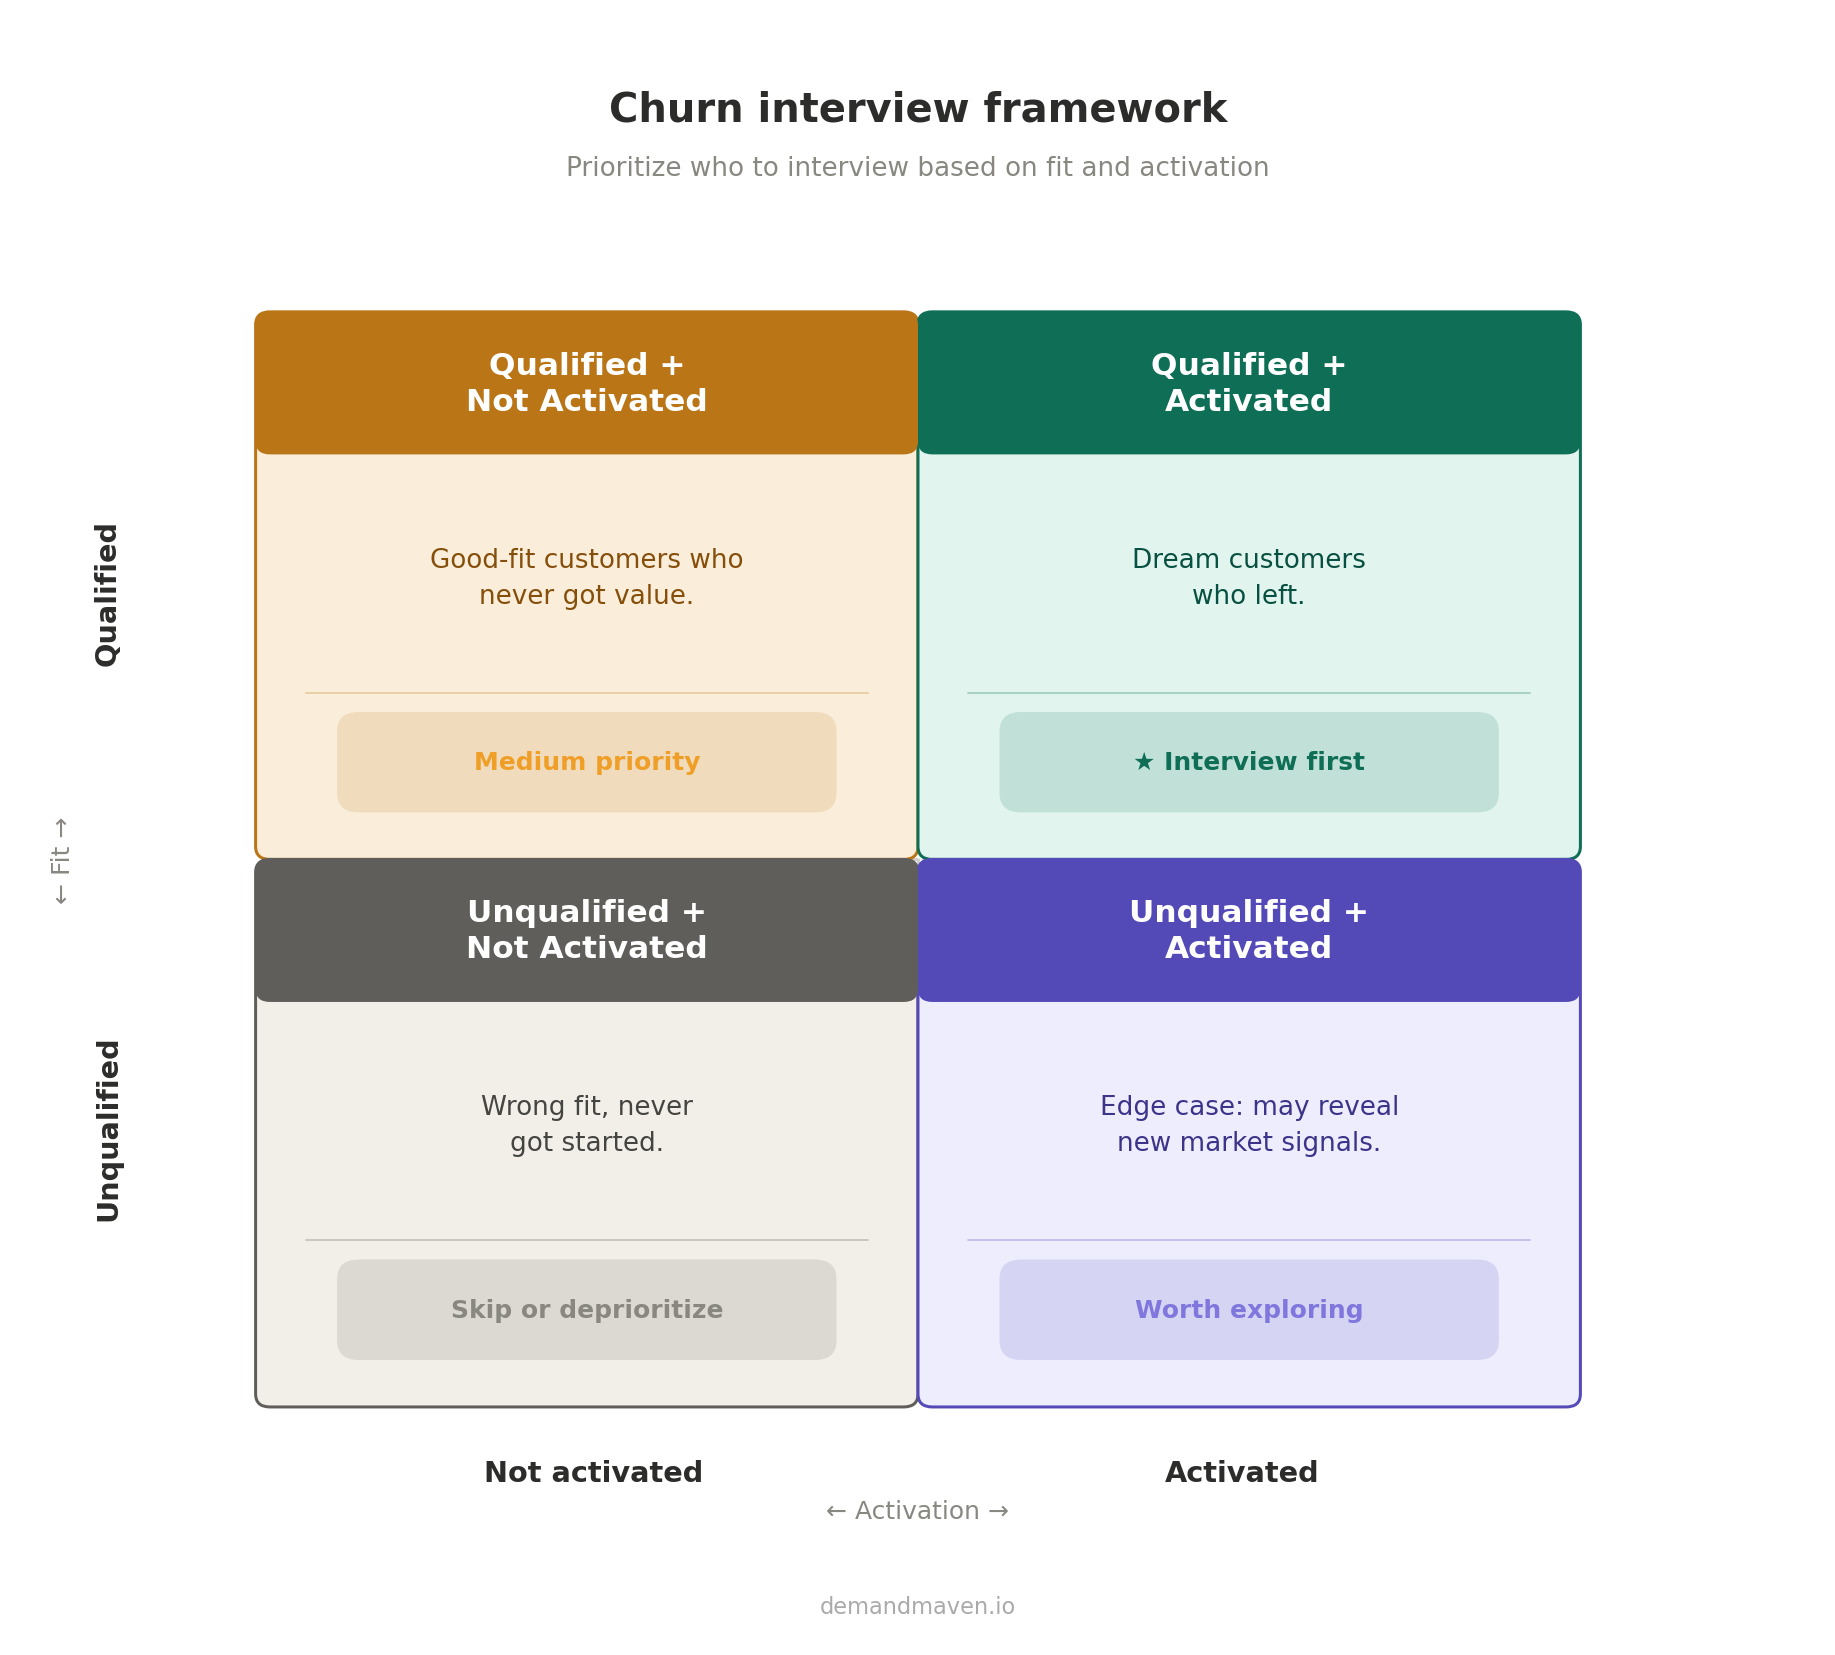
When we conduct churn research, we organize customers into a 2×2 matrix:
Qualified + Activated: These are your dream customers who left—highest priority to understand
Qualified + Not Activated: Good fit customers who never got value—activation problem
Unqualified + Activated: Interesting edge case—might reveal new market opportunities
Unqualified + Not Activated: Lowest priority
We typically interview 5-10 people from each relevant bucket, offering gift cards to incentivize participation. The goal isn’t to win them back—it’s to understand the patterns that lead to churn vs. retention.
Pro tip: Don’t do churn research until you’ve also interviewed happy, retained customers. You need the “control group” to understand what good retention looks like.
What churn analysis actually reveals
Good churn research doesn’t just tell you why people leave—it reveals opportunities across your entire business:
Acquisition issues: Are you attracting too many wrong-fit customers because your messaging isn’t clear enough?
Product marketing gaps: Do customers not realize your product can solve their problems?
Activation problems: Are there consistent hurdles preventing customers from getting initial value?
Product opportunities: What jobs-to-be-done emerge after customers master your core use case?
Monetization issues: Are you pricing yourself out of your best customers or leaving money on the table?
The churn retention hierarchy
When you find churn issues, here’s how to prioritize fixes:
- Fix obvious activation blockers: If qualified customers can’t get initial value, fix that first
- Address product marketing gaps: Make sure customers know what your product can do
- Improve quality-of-life features: Small improvements that reduce friction compound over time
- Build for expansion: Create natural paths for customers to get more value (and pay more)
- Consider new use cases: Carefully evaluate building for adjacent jobs-to-be-done
The bottom line
Your monthly churn percentage is just the tip of the iceberg. Real retention analysis requires digging into qualified vs. unqualified churn, understanding your net revenue retention by segment, and having actual conversations with customers who left.
Most importantly, remember that churn analysis should reveal growth opportunities, not just problems to fix. The goal isn’t just to stop the bleeding—it’s to build a business where customers naturally stick around and expand their usage over time.
If you’re sitting at that “comfortable” 3-5% monthly churn but growth still feels hard, it might be time to dig deeper. The answers are hiding in your data—and in conversations with the customers you lost.
Ready to stop pushing that boulder uphill? Book your free 45-minute growth audit today and uncover the hidden retention opportunities sabotaging your business growth.